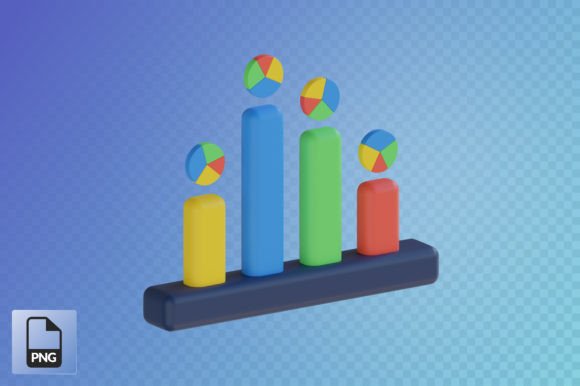
What is a Bar Chart 3D Object and How Can It Enhance Your Design Projects?
A Bar Chart 3D Object is a digital illustration of a bar chart rendered in three dimensions. Unlike traditional 2D bar charts, which are flat and basic, 3D versions add depth, perspective, and visual appeal. These objects are commonly used in design projects such as web design, app development, UI/UX presentations, posters, social media advertising, and content creation to convey data in a more engaging and professional manner.
Understanding the Purpose of a 3D Bar Chart
The primary purpose of a bar chart is to compare different categories or track changes over time. In a 3D format, these visualizations become more dynamic and eye-catching, making them ideal for presentations and marketing materials where aesthetics matter just as much as accuracy.
When designing an application or website that involves data visualization, using a 3D bar chart can make complex information easier to digest. The added dimension helps users perceive differences in values more intuitively and adds a sense of realism to your design.
Why Use High-Resolution PNGs with Transparent Backgrounds?
One of the key features of a high-quality 3D bar chart object is its resolution and background type. Most designers and developers require images that are both high-resolution and have transparent backgrounds, especially when integrating them into digital projects.
- High Resolution (3000x3000 px): Ensures the image looks sharp and clear on all devices, from mobile screens to large billboards.
- PNG Transparent Background: Allows the chart to blend seamlessly with any background color or design without white edges or borders.
This combination makes the 3D bar chart a versatile tool that adapts well to various contexts. Whether you're creating a business dashboard, a promotional poster, or a social media ad, having access to high-quality assets gives you more creative freedom and control over the final output.
Web and App Design
In the world of digital product design, visual clarity is essential. A 3D bar chart can be used to showcase statistics, user analytics, or performance metrics in a clean and modern way. For example, a fitness app might use a 3D bar chart to display weekly progress in workouts or calorie burn. This not only makes the data easy to understand but also enhances the overall user experience by making it visually appealing.
UI/UX Presentations
Designers often present their work to stakeholders using slides or interactive demos. Including a 3D bar chart in these presentations can help highlight key data points and trends effectively. It's particularly useful in explaining how user behavior has changed over time or comparing the success rates of different design iterations.
Posters and Print Media
For print-based projects like infographics or educational posters, 3D bar charts bring a level of professionalism and visual sophistication. They are great at drawing attention to specific data segments and can be easily customized with colors and labels to match the theme of the poster.
Social Media Advertising
With the rise of visual content on platforms like Instagram, Facebook, and LinkedIn, incorporating 3D bar charts into ads can significantly boost engagement. These charts stand out in feeds and can quickly communicate value propositions or performance results in a way that text alone cannot.
Content Creation
Bloggers, YouTubers, and podcasters often need visuals to support their content. A 3D bar chart can serve as a powerful visual aid when discussing market trends, survey results, or comparative analysis. Its realistic appearance adds credibility to the information being presented.
How to Choose the Right 3D Bar Chart for Your Project
Selecting the right 3D bar chart depends on several factors including the context of the project, the audience, and the design style you're aiming for. Here are some tips to guide your decision:
- Understand the Data: Before choosing a chart, ensure you know what kind of data you want to represent. Is it a comparison between products? A timeline of growth? Or a breakdown of percentages?
- Match the Style: If your project has a minimalist aesthetic, go for a sleek, simple 3D bar chart. If it’s more vibrant or playful, choose one with bold colors and intricate details.
- Consider the Platform: A chart used in a mobile app should be optimized for smaller screens, while one for a billboard needs to be highly legible at a distance.
- Use Transparency Wisely: PNG files with transparent backgrounds allow for seamless integration into any layout. Make sure the chart doesn’t clash with the background once placed.
Common Misconceptions About 3D Charts
Despite their popularity, there are some misunderstandings about the use of 3D bar charts. One common belief is that they always enhance data comprehension. However, in some cases, 3D elements can distort the perception of the actual data, especially if the chart is too stylized or lacks proper labeling.
Another misconception is that 3D charts are only suitable for advanced or technical audiences. On the contrary, they can be incredibly effective in simplifying complex datasets for general audiences. The key is to strike a balance between visual appeal and clarity.
Creating Impactful Visuals with 3D Bar Charts
To create an impactful design using a 3D bar chart, consider the following best practices:
- Keep It Simple: Avoid unnecessary effects or animations that might distract from the core message of the data.
- Ensure Readability: Use clear fonts and contrasting colors to make the numbers and labels easy to read.
- Maintain Consistency: Align the chart with the overall color scheme and typography of your project for a cohesive look.
- Optimize for Use: Since you'll likely be working with PNG files, make sure the chart is properly sized and aligned before exporting.
Where to Find High-Quality 3D Bar Chart Objects
If you're looking to incorporate a 3D bar chart into your next design project, you can find ready-made assets online. Many platforms offer downloadable files that are already in high resolution (often 3000x3000 px) and come with transparent backgrounds in PNG format.
These resources are invaluable for content creators, marketers, and designers who don't have the time or tools to build custom 3D charts from scratch. By using pre-designed objects, you can maintain a professional standard while saving hours of work.
Future Trends in 3D Data Visualization
As technology continues to evolve, so does the field of data visualization. With the increasing adoption of AR (Augmented Reality) and VR (Virtual Reality), 3D bar charts may soon be part of immersive experiences rather than static images. This could revolutionize how we interact with data in real-time environments like virtual meetings, training simulations, and interactive dashboards.
Moreover, AI-driven design tools are beginning to offer automated suggestions for data visualization styles, including 3D bar charts. These advancements will empower even non-designers to create compelling visuals with minimal effort.
Conclusion: Why 3D Bar Charts Are More Than Just Decorative
In summary, a Bar Chart 3D Object is much more than a decorative element. It's a strategic asset that can elevate the quality of your designs and improve the communication of data across multiple platforms. When chosen and implemented correctly, these charts can engage viewers, simplify complex ideas, and contribute to the overall professionalism of your work.
Whether you're a seasoned designer or someone just starting out, having access to high-resolution, transparent PNG 3D bar charts is a game-changer. These assets fit well into a wide range of projects and are adaptable enough to meet the needs of diverse industries—from education and business to entertainment and marketing.
So, the next time you're working on a presentation, app interface, or social media campaign, consider adding a 3D bar chart to your toolkit. You’ll not only impress your audience but also make your data more accessible and memorable.